Running the Pivot Report
Launching the report
To start the report using the open definition, press the Start button. If you have made changes to the definition, you will be asked to save them first. The definition screen closes and the Report Viewer is displayed. A progress bar updates as the report is generated; pressing the Cancel button stops loading.
Viewing the report
When the report completes, the results are shown in a grid matching the report definition. If a Catch-All column was included (see Report Definition), any unassigned rows are displayed in red. Any part collisions are shown with a yellow background.
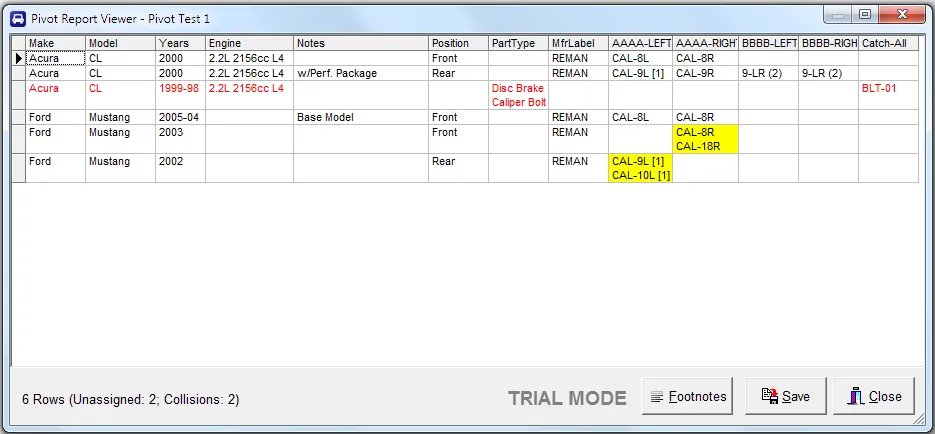
The screen and column widths are resizable. The number of unassigned applications and part collisions are displayed at the bottom-left.
A Collision (yellow fill) is when there are two or more parts in the same cell without “extra stuff” (quantity or footnotes) to differentiate them.
Trial mode limitation
The report runs in TRIAL MODE until you purchase a Professional Edition License and enter it in the Registration screen. The trial edition is limited to displaying 25 rows, however the entire file is still processed so all groupings can be completed.
Footnotes
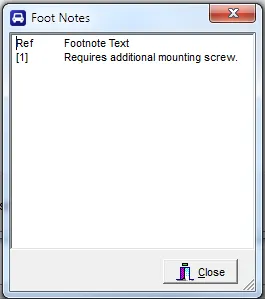
The Footnotes button shows a list of footnotes defined in the report definition:
Save
The Save button exports the report to either an Excel file (provided it is fewer than 65,000 rows)
or a .csv file. If footnotes are defined, a <savefile>_FN.txt file is also created with the footnote
information.