Pivot Report Concept
In spreadsheet programs, a Pivot Table (or cross-tabulation) is a powerful way to summarize and visualize row and column data. AceViewer borrows the name and the basic concept of grouping to “pivot” single part-column ACES files into multi-column part reports. This is a great tool for visualizing your products in a familiar catalog layout, and it provides a way for distributors to combine related part types from several brands and sources. (See the AceMergeBrand.exe utility for a simple way to combine several ACES files into one.)
⚠️NOTE: The Pivot Table Report is a Professional Edition feature. The trial edition processes the entire file but only displays the first 25 rows. See Software Registration.
Stub columns
Most of the work in setting up a report definition is creating the part columns. All other report columns are pre-defined and cannot be changed. They are highlighted below:
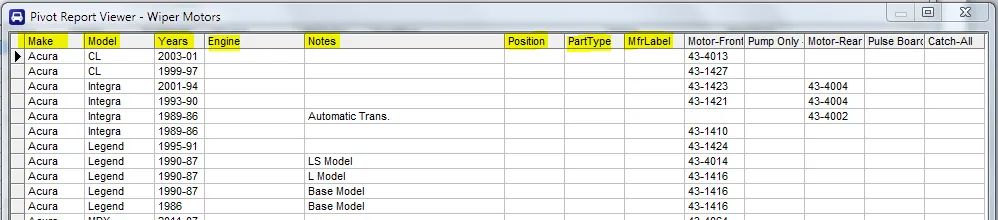
The non-part columns that can be changed by the report are called Stub columns. These are Notes, Position, Part Type, and MfrLabel.
Consolidation
One of the goals when creating a report is to consolidate records to show as many part numbers on the same row as possible. All the columns to the left of the part columns must match for two parts to land on the same row. This can be achieved in two ways:
- Making similar terminology identical (covered in the Part Column Editor and Notes Processing articles).
- Moving fitment information from a stub column into the part column, optionally as a footnote reference.
Both methods are explained in the articles that follow.